[WIP] : improve current timing script #114
Conversation
There was a problem hiding this comment.
Any way to show text for both the time speedup and the time itself?
I often care more about speed-ups when the length of time is large -- the current values shown make it hard to see how the length of time changes between 50 and 300 nodes. Should I care that parallel is slower for 50 nodes?
Any ideas about why it would be slower for 50 nodes? It is doing all n_jobs=-1 processors -- what is making it slower?
We could display both of them by making an annotation dataframe that stores formatted strings. Something like this: Another way could be to create two dataframes (one for the parallel run time and another for speed-ups) and overlaying one over the other. For our use case, I think the annotation dataframe would be much simpler.
 Although the parallel implementation appears to be slower for 50 nodes, the difference in their runtimes is minimal. This is likely due to parallel overhead, which tends to be more noticeable on smaller graphs. Still, the implementation remains efficient overall -- so, it seems reasonable to me to overlook this small dip in small-scale graphs. LMKWYT
|
There was a problem hiding this comment.
not sure why the speed-up with 500 nodes is less than with 300 nodes. Could you please help me understand this?
There was a problem hiding this comment.
How long does it take to run and create this tiing picture? If it isn't very long, try running it a few times and see if the dip in performance between 300 and 500 goes away.
If the results change from run to run, we should try to pick "better" parameters that don't show those slowdowns. Most computers these days have background processes running that can imapct timing scripts. To see through the haze of such noise, we could try multiple runs and take the minimum time from those runs. Another approach is to choose larger problems so the small differences from background processes looks more like noise.
It's also nice to repeatedly double the parameter (or multiply by a constant factor other than 2, like 10). That allows you to see whether the time is increasing like n^2 or n^3. Doubling nodes will take ~8 times longer for O(n^3). Of course, the big-O is only valid in the limit as n-> infinity, so take it all with a grain of salt. But if it is consistently a factor of 8 longer when doubling, you can be fairly constant it is running an O(n^3) code.
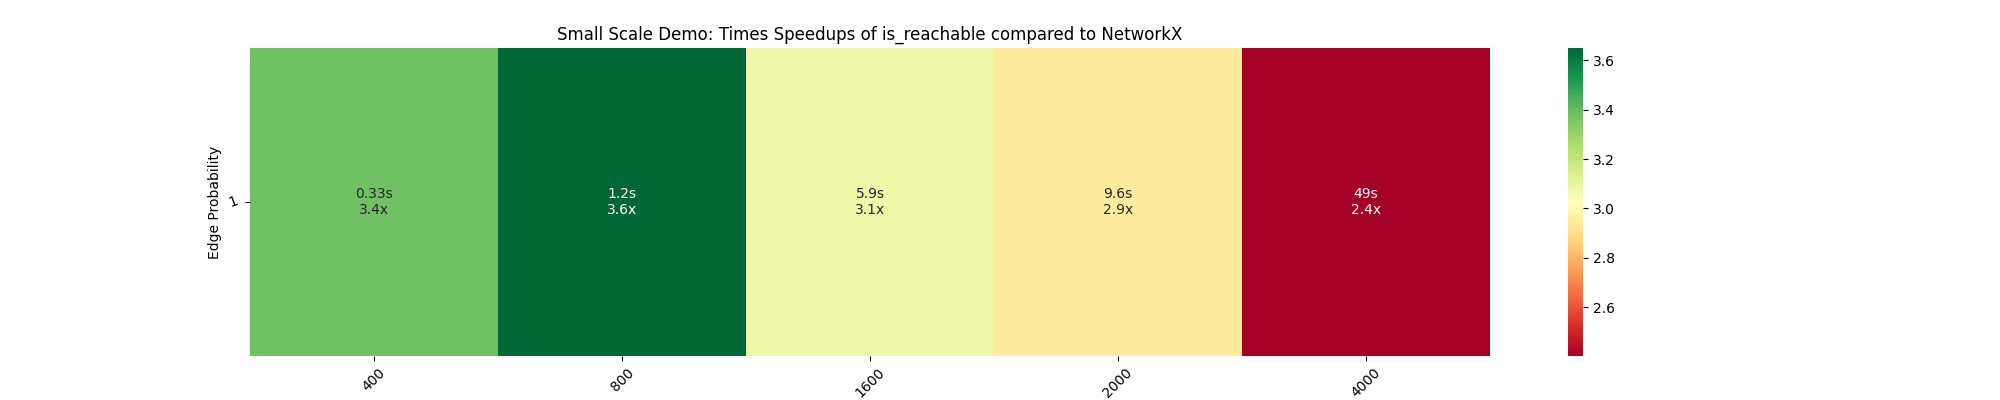
In this case, since we don't care so much about graphs with 50 nodes, and we do care about large graphs. We should probably increase the number of nodes. Maybe start with 250 nodes and double it up to 4000 for this picture. Lots of problems should really be run on 10_000-100_000 nodes. But that would take a long time to do the timing... :)
I guess the point of these plots is to show the impact of parallel code. So the best results would show a factor near 2 for njobs=2 and near 5 for njobs=5. And the title or caption should say what njobs was for the experiment.
:)
There was a problem hiding this comment.
@dschult Thank you for your insights!
How long does it take to run and create this tiing picture? If it isn't very long, try running it a few times and see if the dip in performance between 300 and 500 goes away.
It didn’t take long to run, so I executed it a few more times to check if the dip was just a one-off. What I observed was that the speedup would initially peak, but then wouldn't yield any speedup for larger number of nodes.

After some debugging, I found the issue was in the is_reachable function, where num_in_chunk was being passed instead of n_jobs:
num_in_chunk = max(len(G) // n_jobs, 1)
node_chunks = nxp.chunks(G, num_in_chunk)
needs to be replaced with:
node_chunks = nxp.chunks(G, n_jobs)
This is being addressed in PR#112
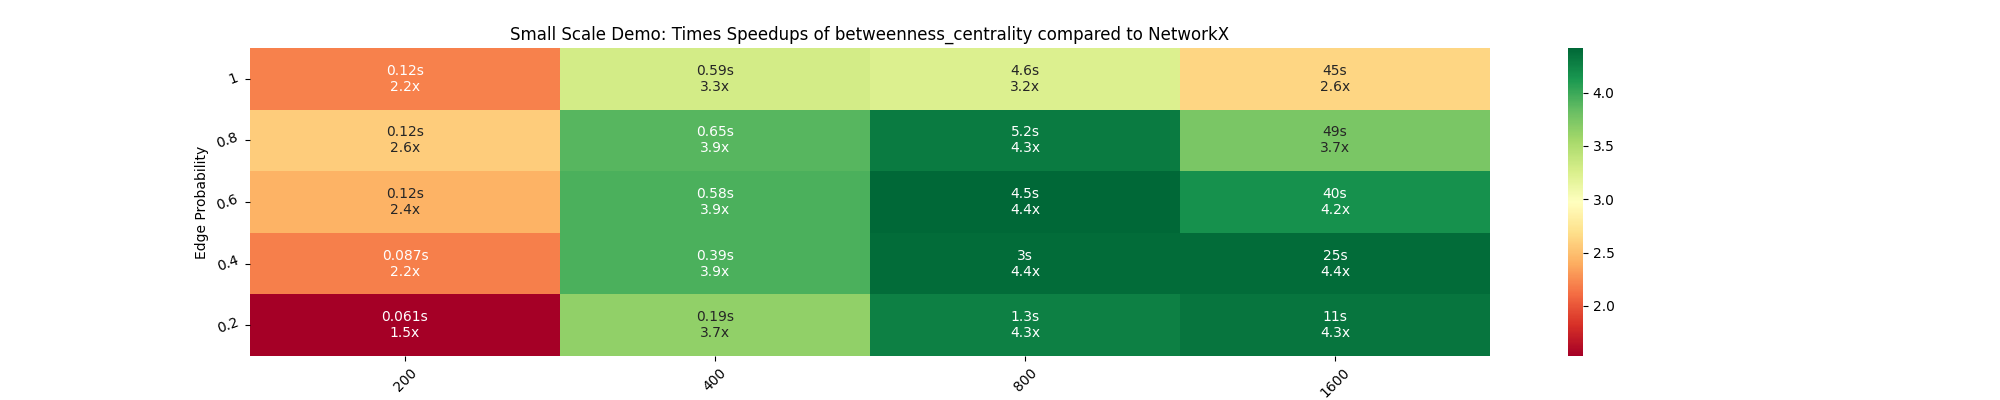
After applying that fix, I ran it 5 times and considered the minimum time from these runs for both is_reachable (ref. heatmap) and betweenness_centrality (ref. heatmap). However, I still observe a decline in speedup at higher node counts. Could this be due to system limitations?
System details:
MacBook Pro 13-inch M2
macOS Sequoia 15.5
Apple M2 Chip
Memory 8GB
There was a problem hiding this comment.
Yay!! So good to hear you found one fix. Too bad there are still some mysteries.
Let's see -- are we running into memory issues? (probably not.... 1600 nodes -> 2.5M edges for the complete graph (prob=1)... each takes about 32-128 bytes so I think the 8GB memory would be OK unless the data has to be copied many times in the parallel version. I think they share memory, but I'm not sure.
Let's hope it is another bug. One that involves code that affects both of these functions. I guess start in the utility functions that are called in both functions.
d12a986 to
6174eb3
Compare
|
Hi @dschult, I had previously added another commit to move numpy to the test dependencies, but I think it might not have been pulled. Would you like me to reapply that? |
|
Yes -- I'm very sorry to have lost that commit to the PR. I didn't pull the latest changes when I rebased on the main branch. It all looks good now that you reapplied that. 🚀 |
|
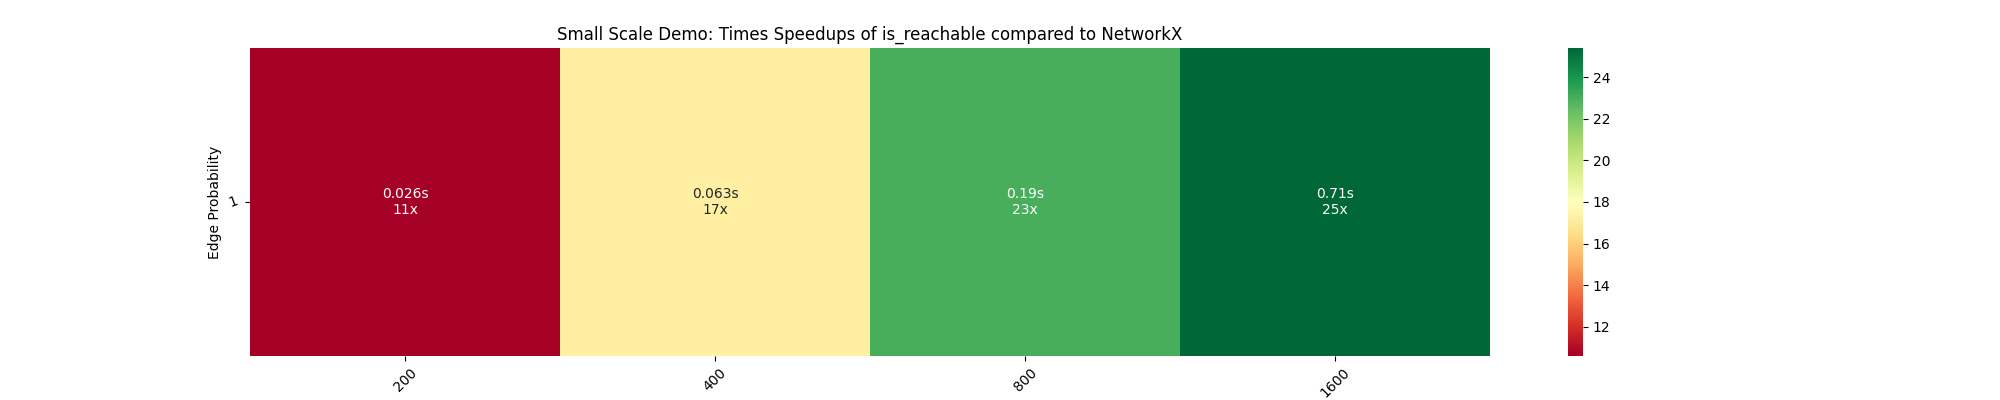
In the recent commit, I tried to implement memmapping in I replaced NetworkX's graph object with a NumPy-based adjacency matrix. This is because the problem involved making multiple copies of the input graph for each worker. The heatmap obtained gives speedups ranging from 11x to 25x with this change, view heatmap. Note : the current implementation assumes that the graph nodes are integers — I plan to make this more dynamic soon. One potential drawback is the memory usage in case of sparse graphs. |
|
Interesting that they have special tools for numpy arrays, but not for python objects. nodelist = list(G) # map of integers to nodes
nodemap = {n: i for i, n in enumerate(nodelist)}Those are good speeds -- so it looks like memory might be an issue more generally too. It might be possible to use a numpy matrix in a more memory efficient way than the adjacency matrix. Another approach would be to use a scipy sparse array. So, there are lighter memory ways to handle adjacencies. But let's not worry about that yet. Do I understand the memmap model? The array is written to a file and then each process has read access to that file. So it uses hard disk space instead of memory to share the data. It looks like there is a Python standard library version of this called mmap. I wonder if that works well with dicts. But numpy is very fast so it might be better to just stick with Very cool! |
I like this idea of using an NxM numpy array as an adjacency list -- would be an efficient way of expressing it. I'll work my way with this. Thanks for the insights :)
Yep, that’s pretty much it! |
|
+1 for moving the adjacency stuff to a separate PR. :) |
|
Do we still need |
|
I think we can delete that file too. |
This reverts commit 472d395.
a82b405 to
f45627d
Compare
timing/timing_individual_function.py
Outdated
| ax.set_xlabel("Number of Vertices", fontweight="bold", fontsize=12) | ||
| ax.set_ylabel("Edge Probability", fontweight="bold", fontsize=12) | ||
|
|
||
| n_jobs = nxp.get_n_jobs() |
There was a problem hiding this comment.
i'd recommend using get_active_backend()[1] instead of get_n_jobs here-- bcoz the first one gives the n_jobs that joblib has stored and used while running the code(and we are using joblib's config system in this script).
There was a problem hiding this comment.
hmmm...
It seems confusing that get_n_jobs doesn't get whichever config system's value is being used here. Would that be hard to do? Are there other utility functions like it that we could make work with whichever config system is being used?
There was a problem hiding this comment.
i'd recommend using
get_active_backend()[1]instead ofget_n_jobshere-- bcoz the first one gives the n_jobs that joblib has stored and used while running the code(and we are using joblib's config system in this script).
I'm more aligned with merging this after PR #122, then n_jobs would be set via nx.config.backends.parallel.n_jobs
This reverts commit f45627d.
This reverts commit 924bc27.
Co-authored-by: Aditi Juneja <[email protected]>
There was a problem hiding this comment.
Just leaving my comments in the conversations for this PR. I don't think any of these points are blocking -- we can do them in later PRs too. But we might as well decide here and avoid it later.
- add printing of probability of edges along with the number of nodes when running the timing.
- move the random seed setting to the beginning of the timing script.
I'll look into whether we can update the config utility functions like get_n_jobs to report based on whichever config system is currently being used.
timing/timing_individual_function.py
Outdated
| ax.set_xlabel("Number of Vertices", fontweight="bold", fontsize=12) | ||
| ax.set_ylabel("Edge Probability", fontweight="bold", fontsize=12) | ||
|
|
||
| n_jobs = nxp.get_n_jobs() |
There was a problem hiding this comment.
hmmm...
It seems confusing that get_n_jobs doesn't get whichever config system's value is being used here. Would that be hard to do? Are there other utility functions like it that we could make work with whichever config system is being used?
improves #51